2015-03-03 07:50:46 +08:00
|
|
|
QSpectrumAnalyzer
|
|
|
|
|
=================
|
|
|
|
|
|
|
|
|
|
Spectrum analyzer for RTL-SDR (GUI for rtl_power based on PyQtGraph)
|
|
|
|
|
|
2015-03-03 08:07:00 +08:00
|
|
|
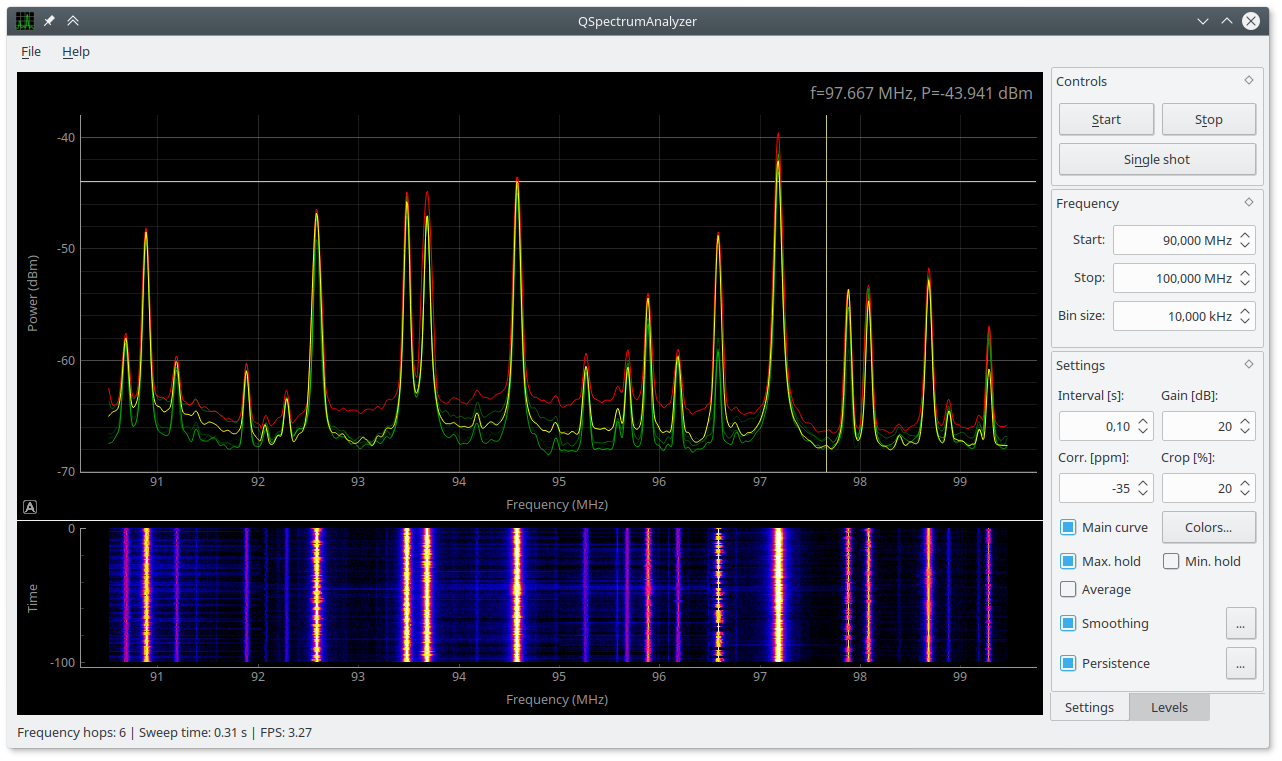
Screenshot
|
|
|
|
|
----------
|
|
|
|
|
|
|
|
|
|
|
|
|
|
|
|
2015-03-03 07:50:46 +08:00
|
|
|
Requirements
|
|
|
|
|
------------
|
|
|
|
|
|
2015-03-03 08:07:00 +08:00
|
|
|
- Python >= 3.3
|
2015-03-03 07:50:46 +08:00
|
|
|
- PyQt >= 4.5
|
|
|
|
|
- PyQtGraph (http://www.pyqtgraph.org)
|
|
|
|
|
- rtl-sdr (https://github.com/keenerd/rtl-sdr)
|
|
|
|
|
|
|
|
|
|
You should use Keenerds fork of rtl-sdr (latest Git revision),
|
|
|
|
|
bacause `rtl_power` in original rtl-sdr (from osmocom.org) is broken
|
|
|
|
|
(especially when used with cropping).
|
|
|
|
|
|
|
|
|
|
Usage
|
|
|
|
|
-----
|
|
|
|
|
|
|
|
|
|
Start QSpectrumAnalyzer by running `qspectrumanalyzer`.
|
2015-03-04 07:15:20 +08:00
|
|
|
|
|
|
|
|
If you don't have `rtl_power` executable in system path, you can specify
|
2015-03-04 07:17:07 +08:00
|
|
|
location of it manually in _File_ -> _Settings_. You can also specify waterfall
|
2015-03-04 07:15:20 +08:00
|
|
|
plot history size in there. Default is 100 lines, be aware that really large
|
|
|
|
|
sweeps (with a lot of bins) would require a lot of system memory, so don't make
|
|
|
|
|
this number too big.
|
|
|
|
|
|
|
|
|
|
Controls should be intuitive, but if you want consistent results, you should
|
2015-03-04 07:21:20 +08:00
|
|
|
turn off automatic gain control (set it to some fixed number) and also set
|
2015-03-04 07:15:20 +08:00
|
|
|
crop to 20% or more. For finding out ppm correction factor for your rtl-sdr
|
|
|
|
|
stick, use [kalibrate-rtl](https://github.com/steve-m/kalibrate-rtl).
|
|
|
|
|
|
|
|
|
|
You can move and zoom plot with mouse, change plot settings or export plots
|
|
|
|
|
from right-click menu. Waterfall plot black/white levels and color lookup
|
|
|
|
|
table can be changed in mini-histogram widget.
|